Business Intelligence for Student Housing: A Game Changer Arrives
-

True story: a property manager recently shared that she had broken down in tears when shown how RealPage Business Intelligence for Student Housing could crank out in 10 minutes the reports she had been manually assembling from dozens of individual property spreadsheets—requiring as many as 20 painful hours, a lot of it during her free time.
Business Intelligence (BI) has finally arrived for managers of student housing, and it’s changing everything about how decisions are made and performance is monitored. It gives you an instant lens into the student housing data that’s important to you in your particular job, without having to pull diverse data together into reports, waiting for someone else to create them for you, or trying to gain insights directly from rows and columns of numbers.
This technology consolidates all your data at the property, regional and portfolio levels in a single platform, allowing you to slice, dice and view the data any way you want to—in many cases, in the form of eye-opening charts and graphs. This includes both financial and operational data, no longer locked in separate silos but flowing in from every direction to a central database where it’s ready to be extracted according to the particular needs and interests of managers and partners at every level.
The walls come tumbling down
Your operational data is housed in different systems depending on function. Service requests are in one place; lease expirations in another; wait list and returning student data in another, and so on.
Then there are your KPI’s (Key Performance Indicators) such as revenue, expenses, NOI, rent growth and preleased/current occupancy—metrics critical to your company’s decision makers.
The beauty of BI is that it lets you choose the operational and financial data important to you, then culls this information from wherever it resides and displays it in graphic format on a custom dashboard that keeps you on top of everything at a glance. There are dozens of KPIs that can be displayed, with more being added all the time. You can also schedule reports to be run and distributed to you and others on whatever schedule you choose.
Let’s say you’d like to look at marketing spend next to occupancy rate and rent levels in order to seek a correlation between them. Or look at the impact of renovation costs on NOI in the short term and increased rents going forward. What was once a cumbersome, time-consuming process of pulling data together for analyses such as these is now simple and streamlined.
Site managers will of course be looking at different data on their dashboards: billing and invoices, work orders, turns, wait list status, budget constraints and other site-level data.
One high-level manager reports that when he’s on the phone with regional or site managers, he always has them pull up and view the same BI data he’s looking at as they review performance, so they’re on the same page as they speak.
A top benefit of the BI dashboard is that weak spots in a portfolio needing attention—say below-market rent growth at one property or sinking occupancy at another—no longer must be searched for property by property, or by asking for reports to be assembled. You can scorecard all of your Key Performance Indicators, quickly highlighting outliers (both good and bad) so you know where to focus your efforts at improvement and where to simply give kudos.
Tracking trends
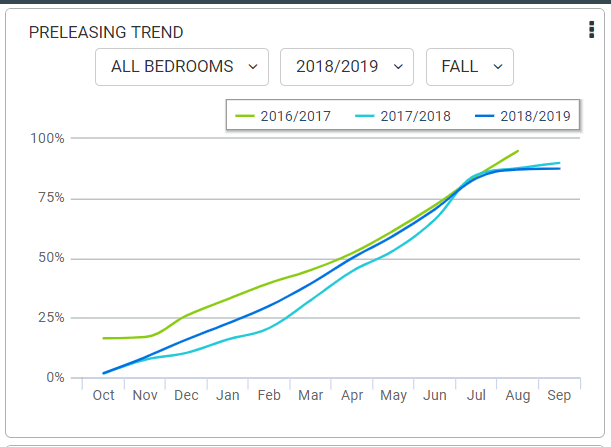
BI lets you compare what’s happening now to the same period in the prior year (or quarter-on-quarter) so you can look at trends in terms of both market and internal performance. How is your pre-leasing looking compared to the same time last year? And the year before that? Do you need to pump your marketing spend up a bit over the next 60 days? And if so, which marketing sources are giving you the best bang for the buck? Has your renewal rate dropped? Are more freshman moving out after their first year, so you should work on retention? How are repair and renovation costs trending up or down, and how are they affecting NOI?


Looking deeper into data
Not only can you look back in time for comparison, but you can also drill down from the highest level portfolio data all the way to the unit or bed level. So if you’re a manager responsible for performance and want to see what lies beneath a weak occupancy number, for example, you can drill down to look at a group of properties or one property at a time within the group.
Perhaps a couple of properties are failing to hold on to the students they’re leasing to and a renewal incentive program is in order; or maybe they need a stronger effort to attract new prospects, with two competitive properties having recently been completed in the same area. How much are they spending on marketing? If it’s plenty, is there perhaps weak follow-through on leads?
With all the recent hype about the value of the data you’re capturing in your computer system every day, it’s important to note that raw data is worth very little. Everything comes down to turning it into useful information that delivers actionable insights. The arrival of BI marks a significant milestone in this endeavor, displaying in living color the metrics you need for profitable decision making.