The Best and Worst Performing Submarkets Since the Pandemic

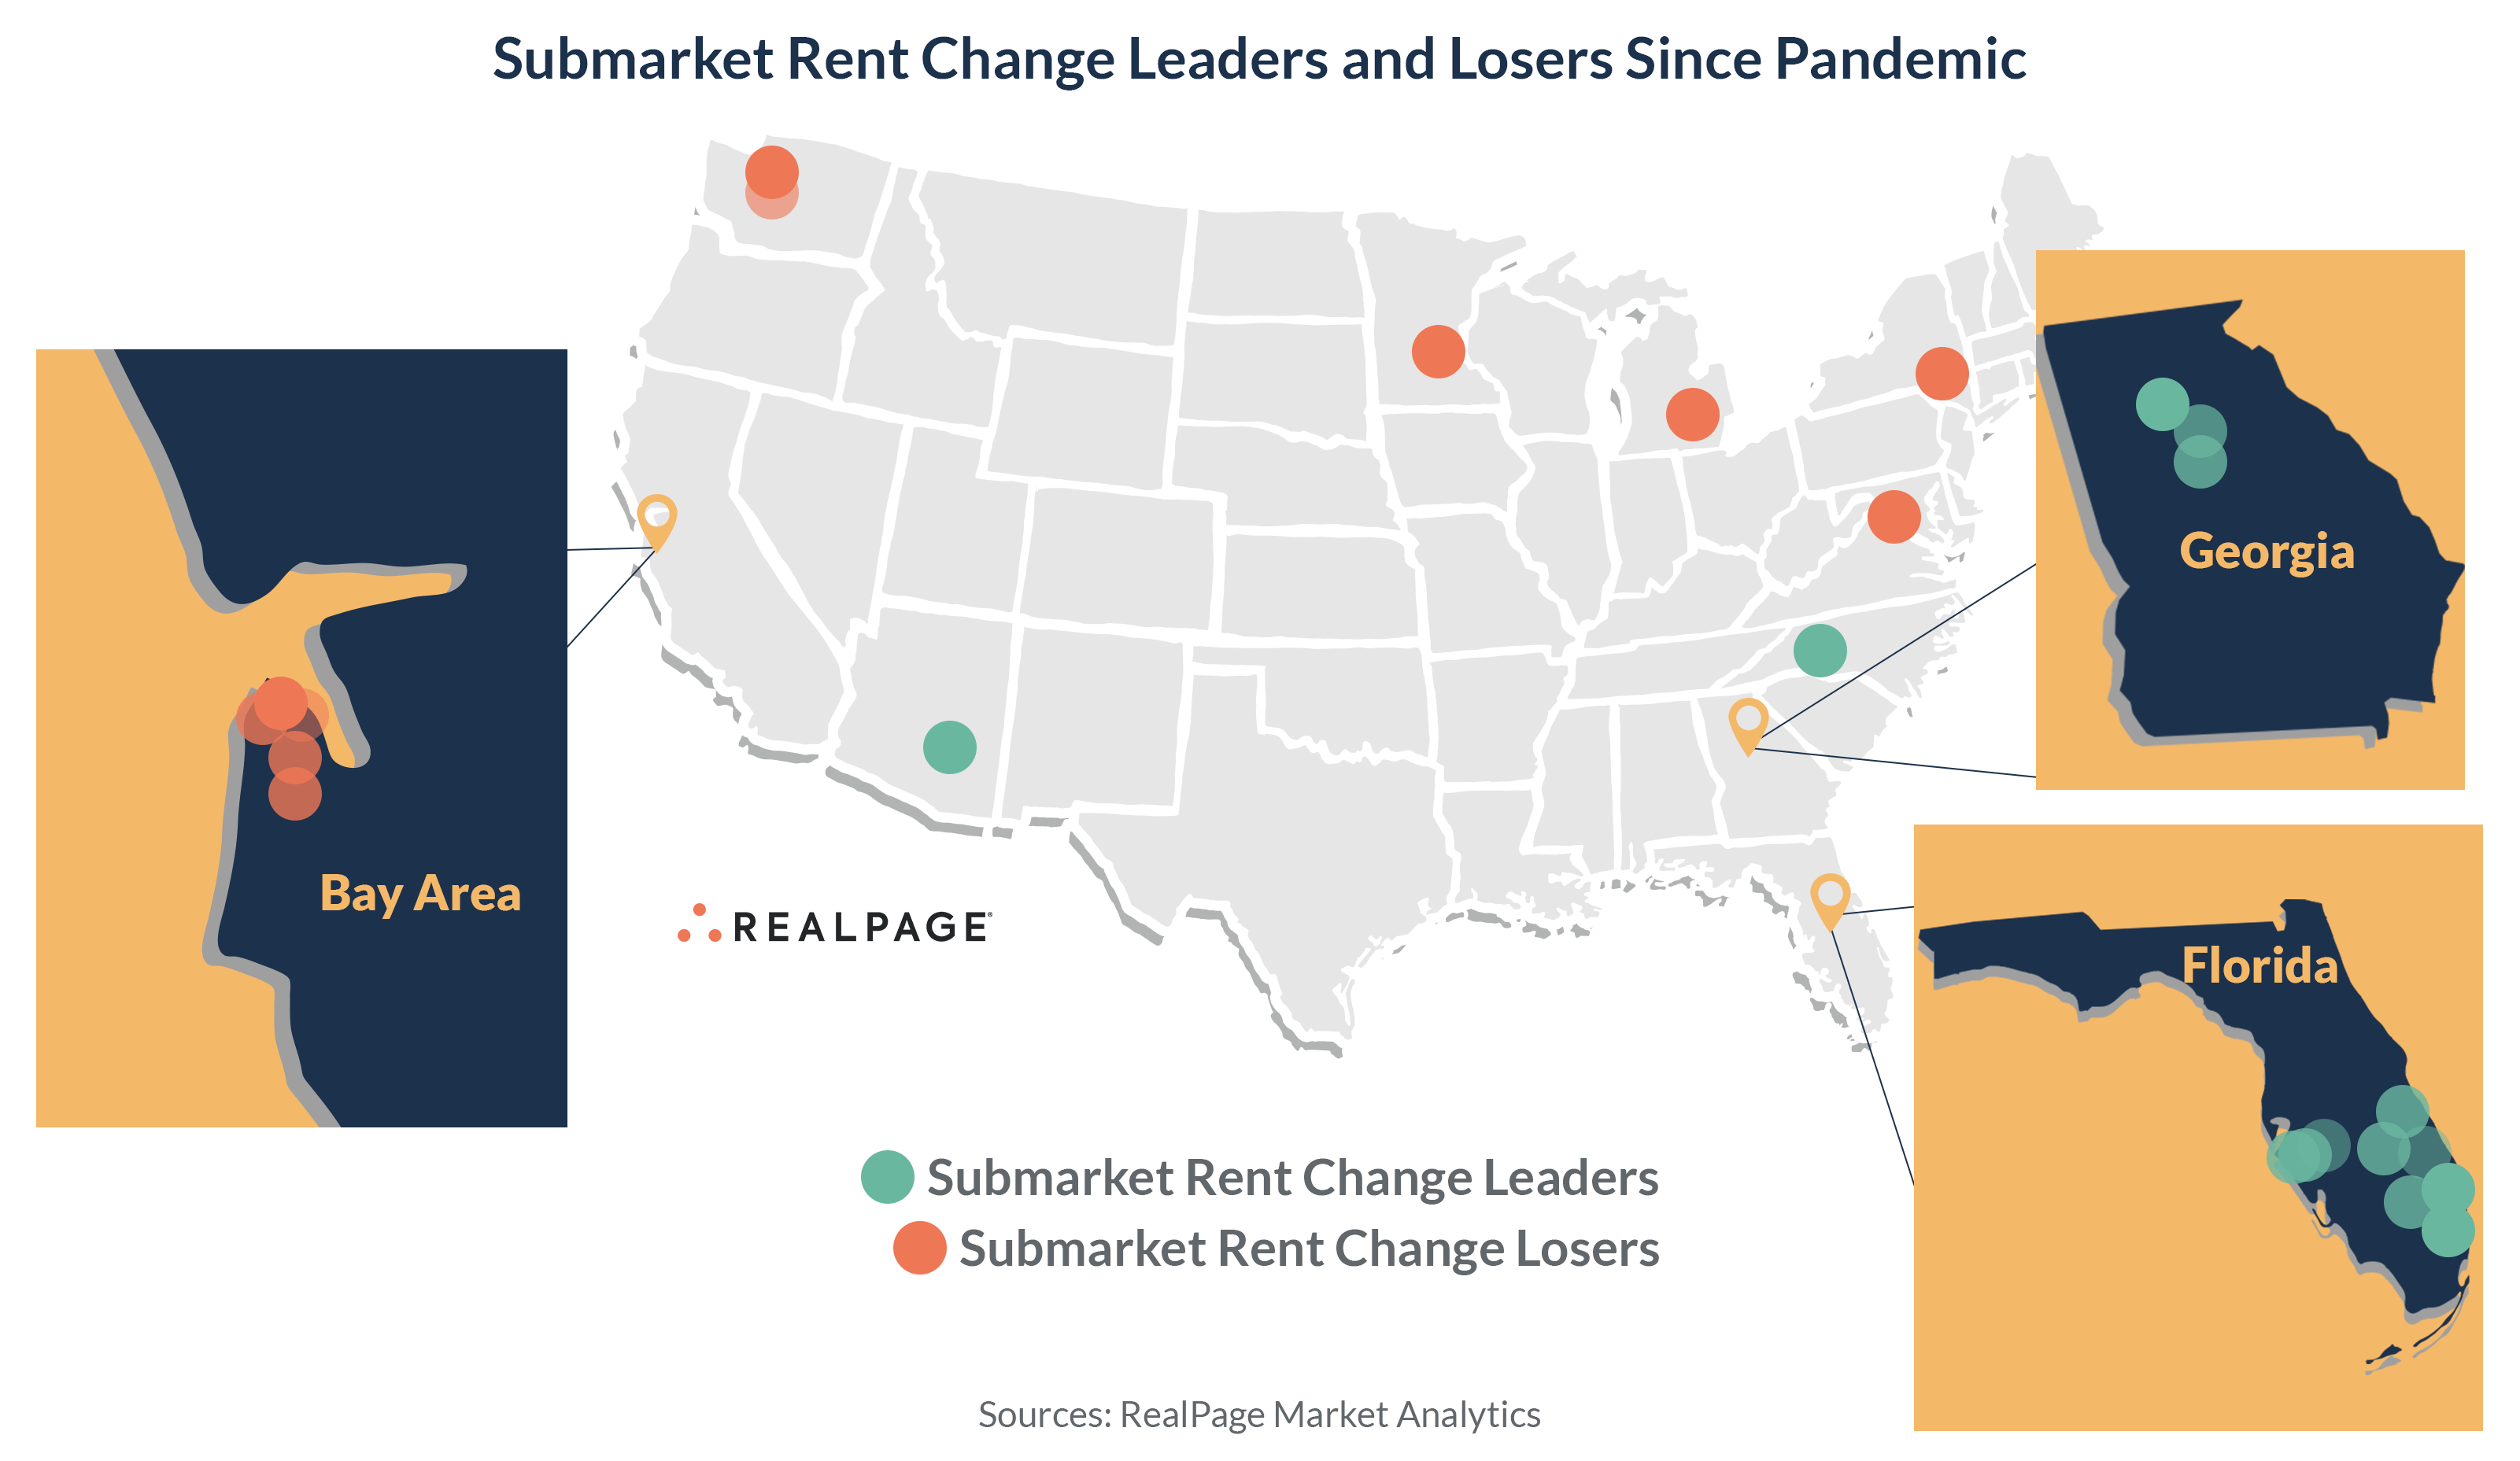
Sun Belt submarkets in suburban areas, primarily in Florida, have seen the nation’s strongest rent performances since the start of the pandemic. Meanwhile, rents among urban Gateway submarkets have recorded the weakest performances during that time. That marks a big turnaround from the previous cycle from 2010 to 2018, when many of the best performing submarkets in the nation were in the West region.
RealPage Market Analytics examined the 706 submarkets within the 50 largest apartment markets in the country and ranked them based on total effective asking rent change from March 2020 to February 2023. That analysis resulted in some clear geographic patterns.
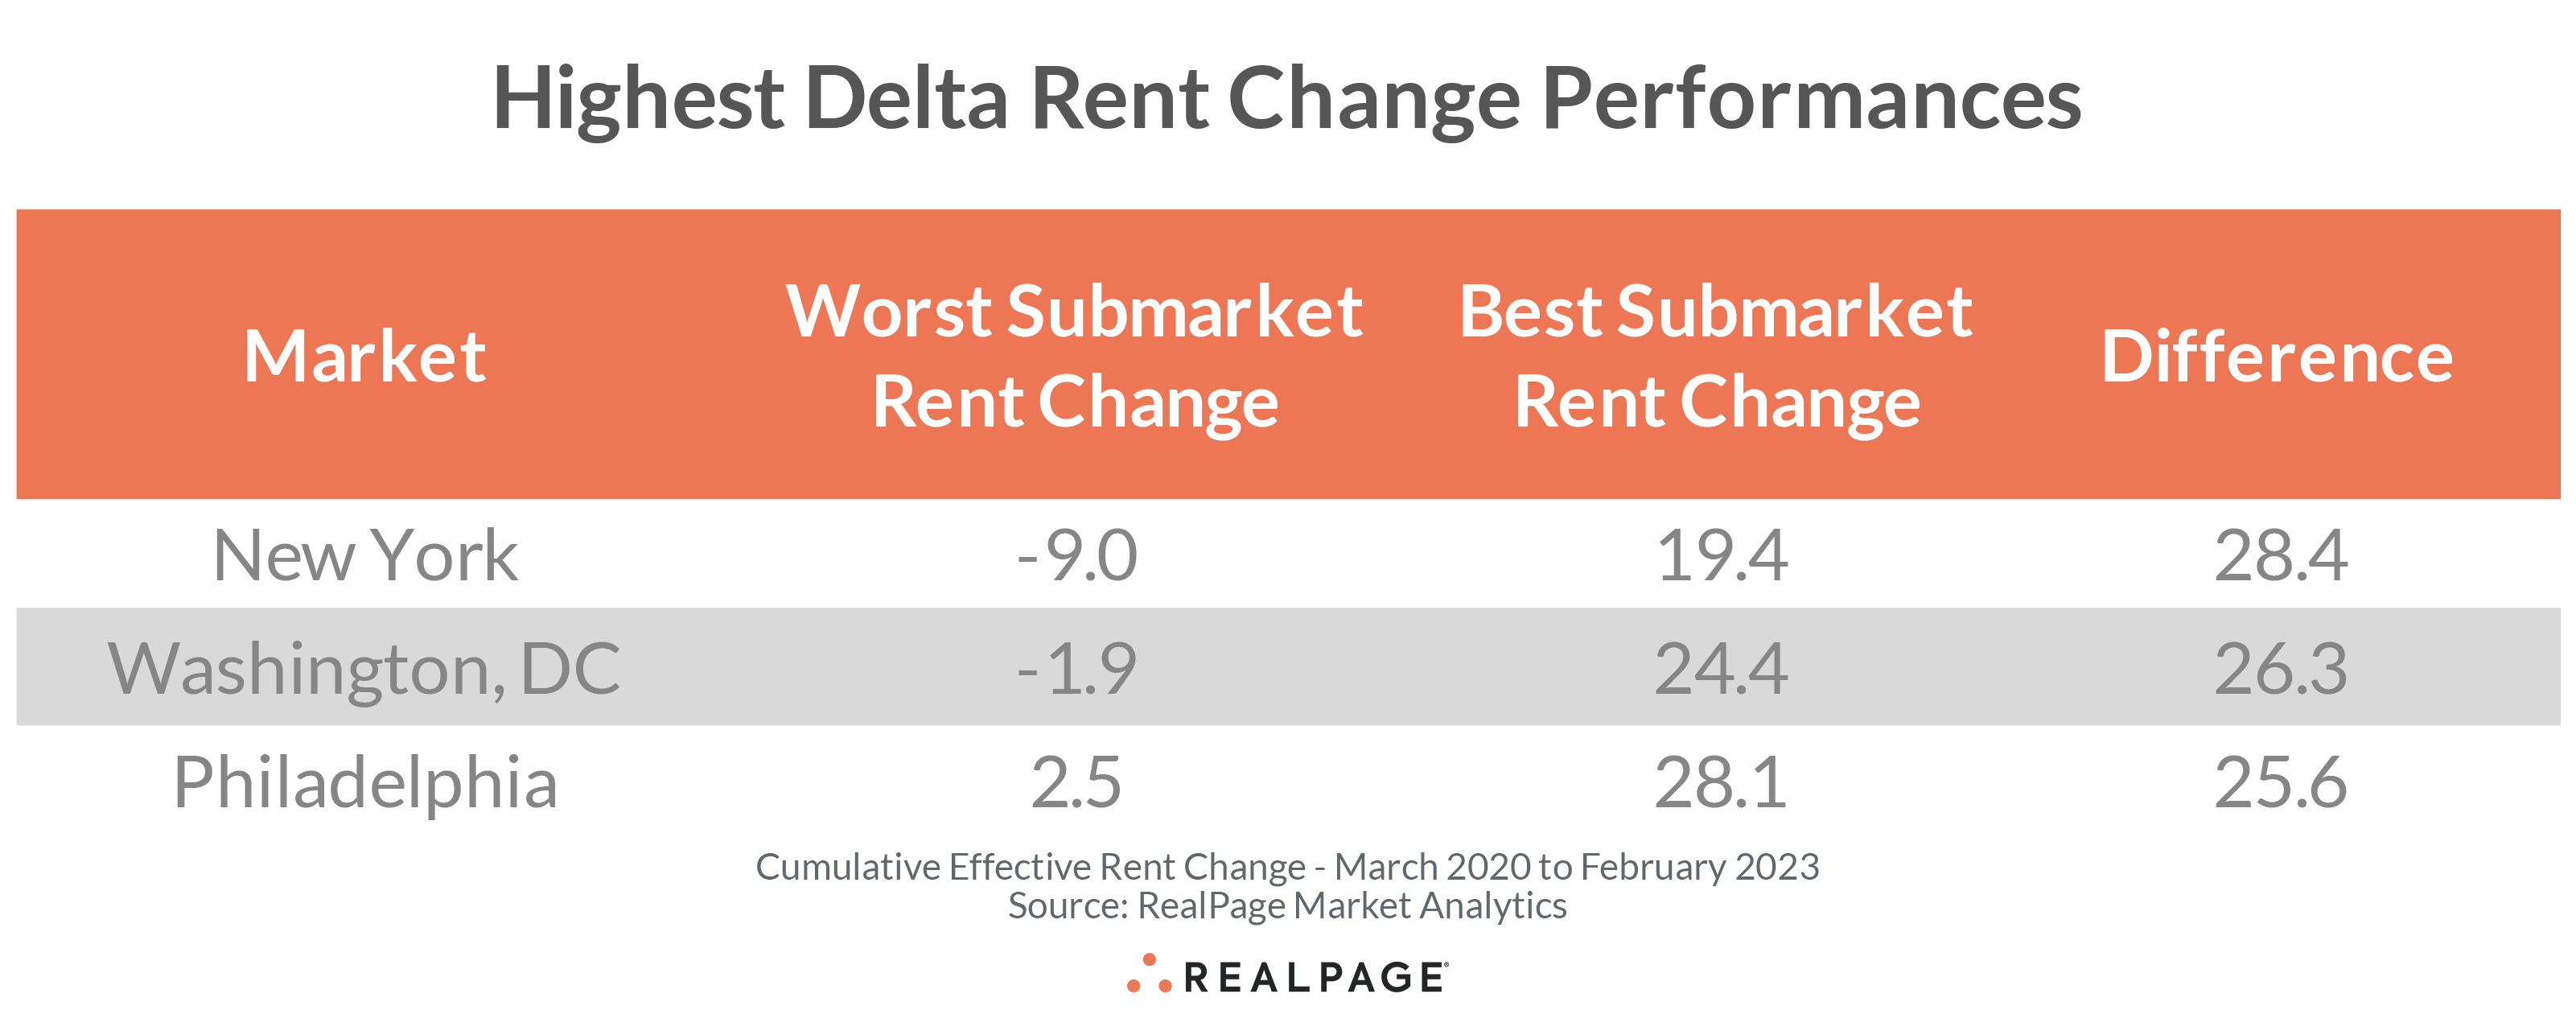
Looking within individual markets, New York reported the biggest rent change bifurcation among its submarkets since the start of the pandemic with a delta of 28.4 points between the strongest rent performance (New York Northern Suburbs) and the weakest rent performance (Harlem). Big bifurcations were also seen in Washington, DC (26.3 points) and Philadelphia (25.6 points).
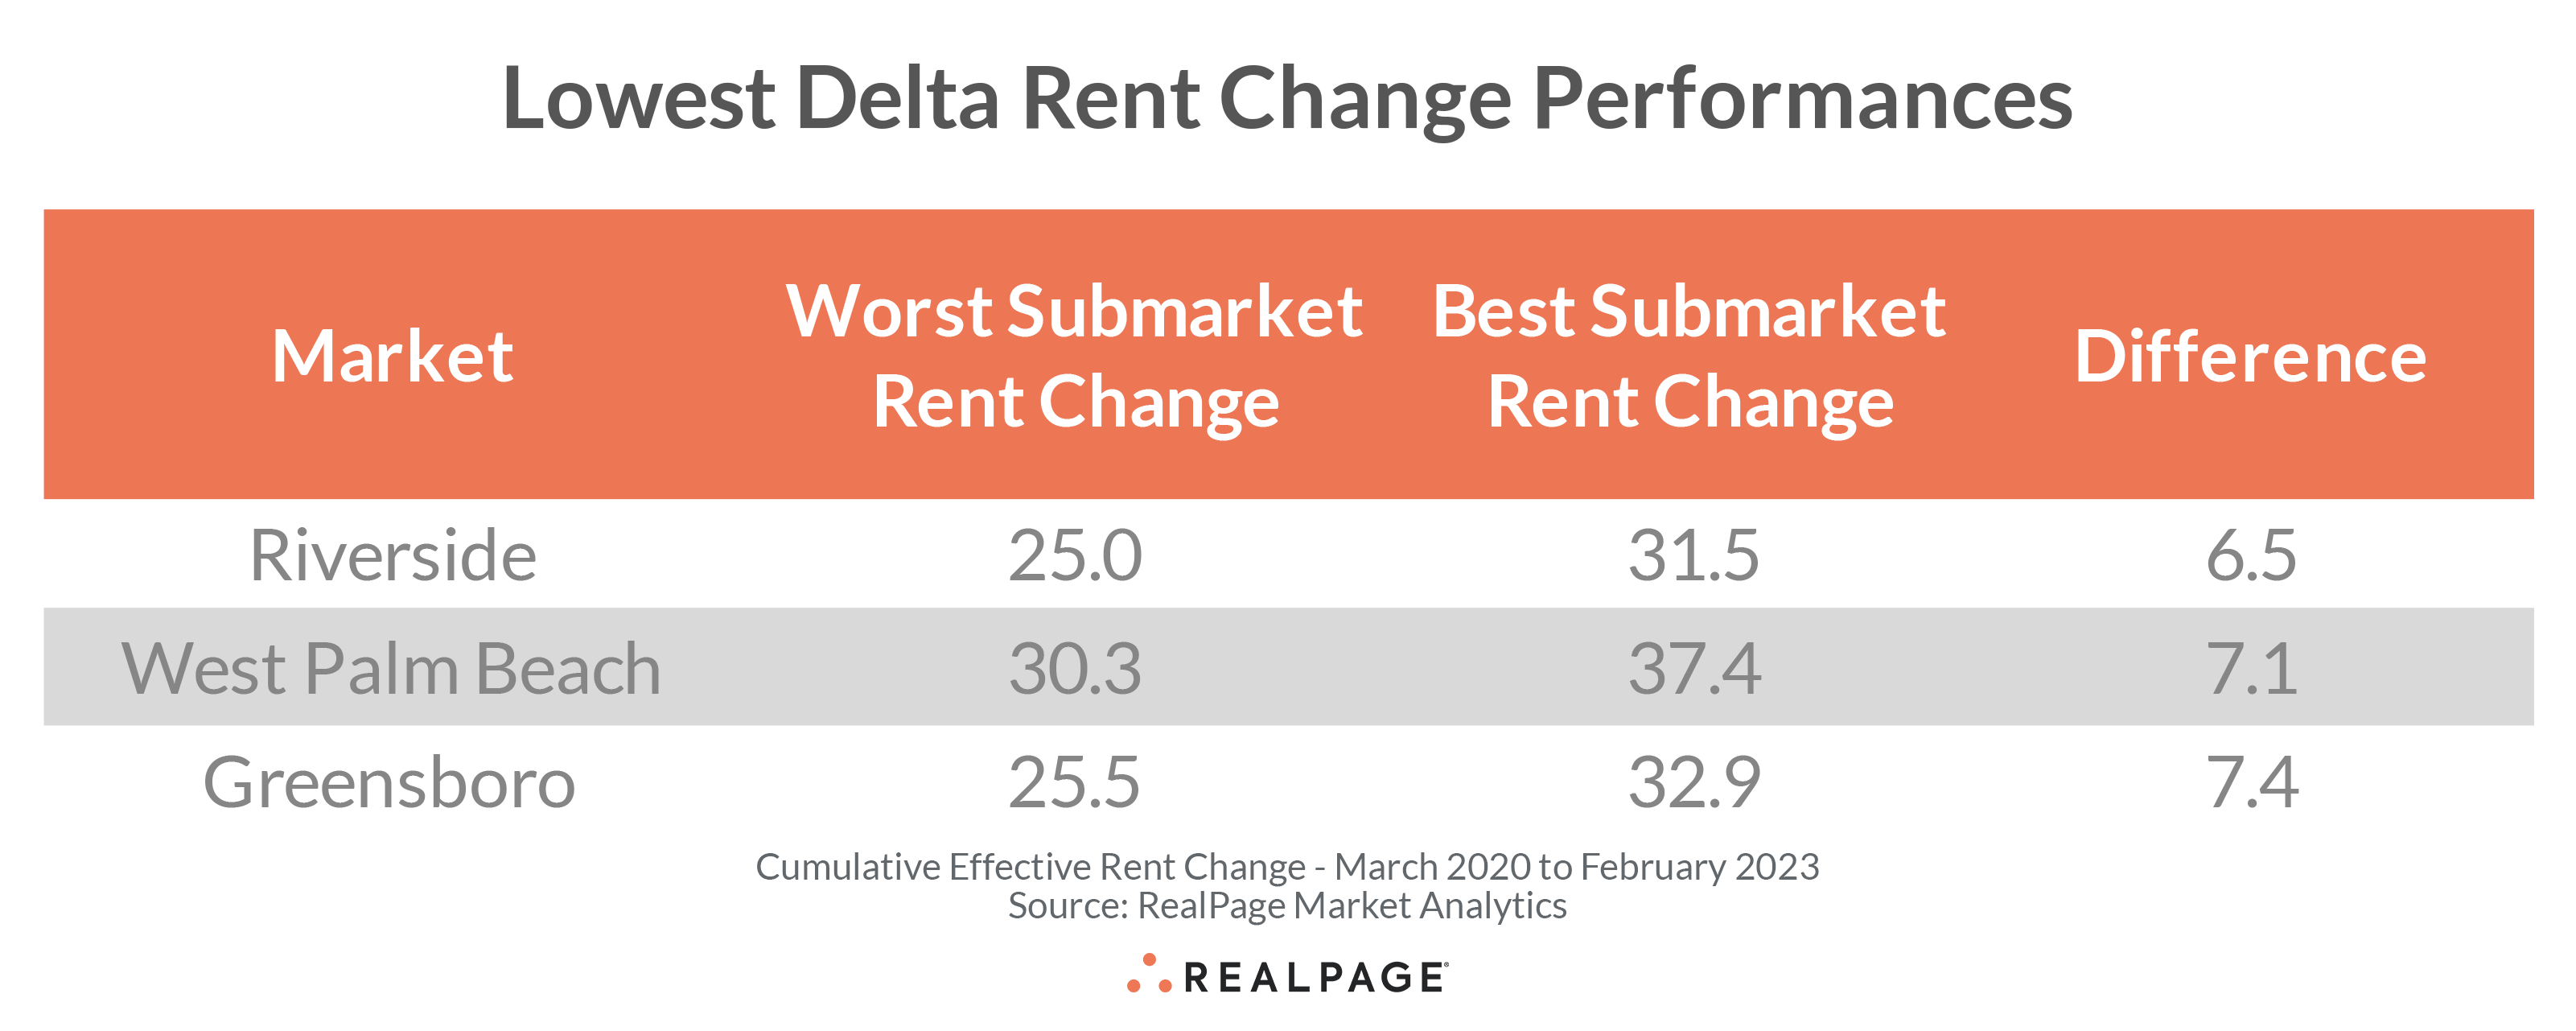
The smallest deltas in rent change performances were among submarkets in Riverside (6.5 points), West Palm Beach (7.1 points) and Greensboro/Winston-Salem (7.4 points).
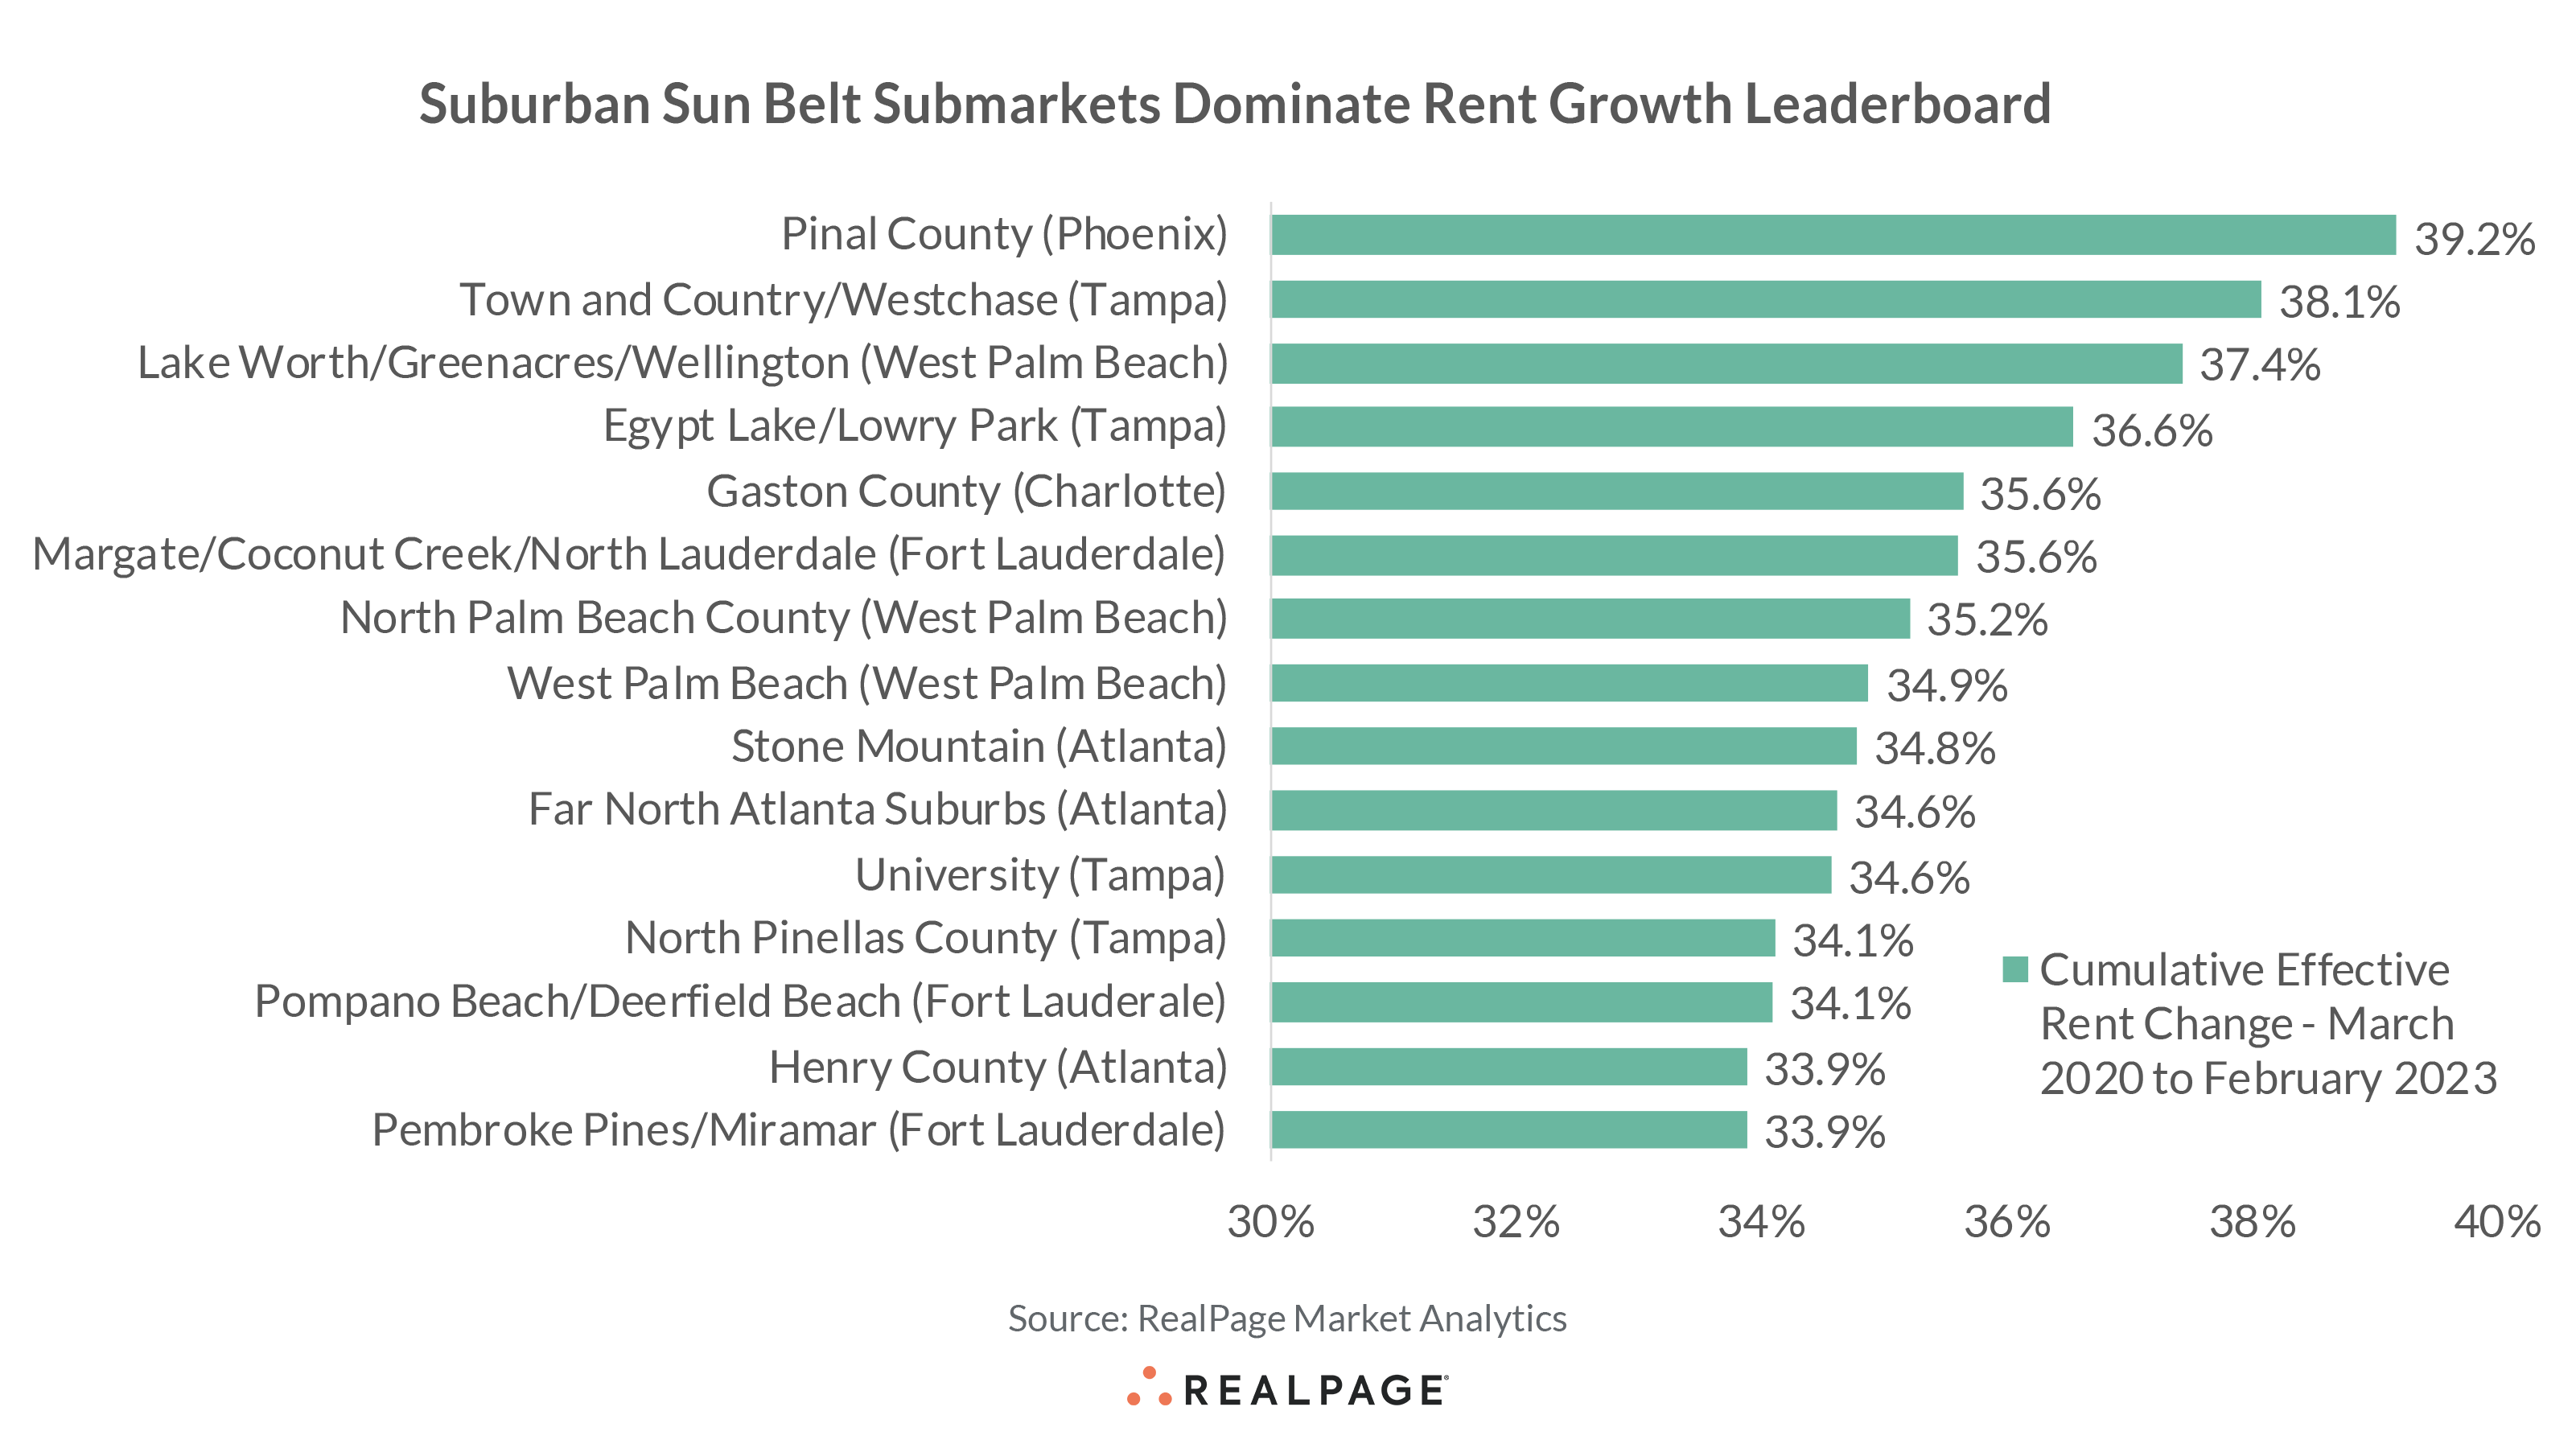
Among the nation’s top submarkets for rent growth since the start of the pandemic, Phoenix’s Pinal County submarket took the lead, with rent growth of 39.2%. That took effective asking rents in Pinal County to $1,429 per month, though still well below the Phoenix average of $1,620. No other submarket in Phoenix landed among the nation’s top 15 rent growth leaders, but West Phoenix came closest at #25 nationally with rents up 32.5%.
Four submarkets in Tampa landed on the leaderboard, with the Town and Country submarket ranking #2, with rents up 38.1% over the past three years taking average monthly rent to $1,850, just slightly above the Tampa market average of $1,819.
South Florida submarkets dominated the top 15 leaderboard, with three each in West Palm Beach and Fort Lauderdale. West Palm Beach’s Lake Worth/Greenacres/Wellington led the South Florida submarkets, ranking #3 nationally with rents up 37.4% from March 2020 to February 2023. Despite that increase, Lake Worth/Greenacres/Wellington’s monthly rents ($2,197) remain below the West Palm Beach market average ($2,436).
Three submarkets in Atlanta landed on the list, led by Stone Mountain at #9 with rent growth of 34.8%, taking average effective monthly rents to $1,353, still well below the market average of $1,682. The Charlotte market was also represented, as Gaston County ranked #5 nationally with rents 35.6% above the pre-pandemic level. Despite the increase, average monthly rents in that submarket ($1,397) remain below the Charlotte market average ($1,582).
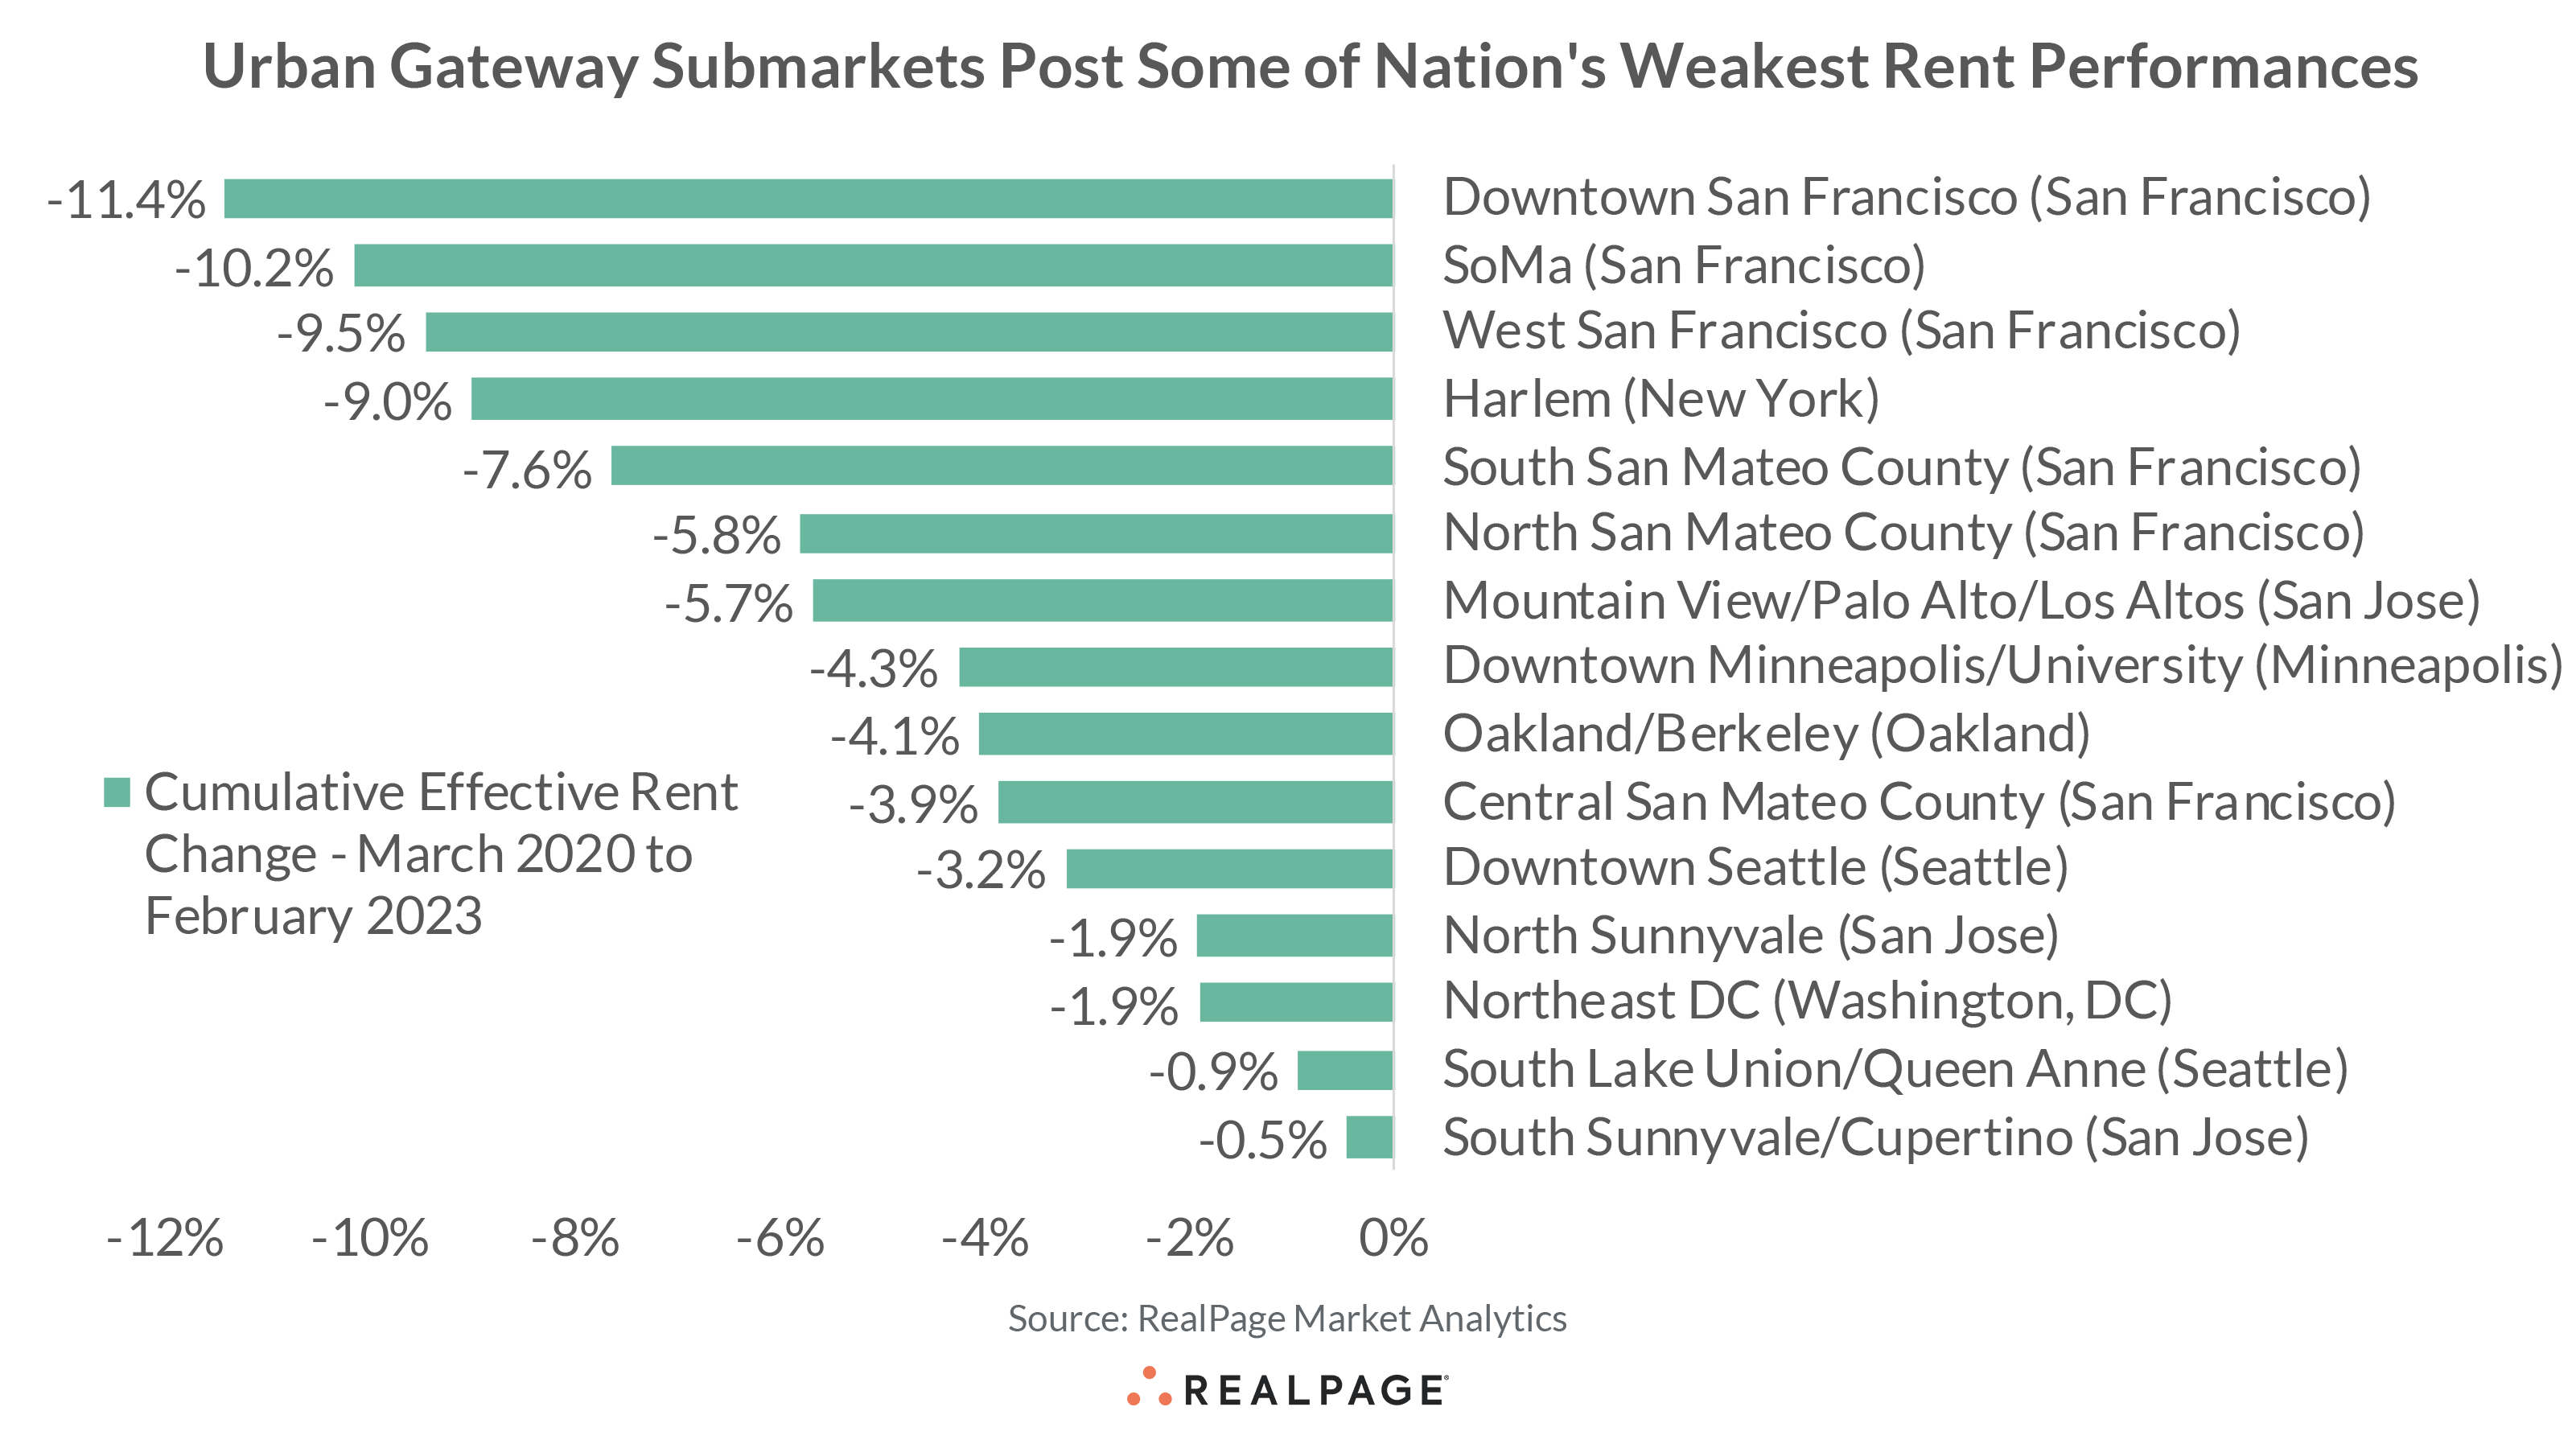
Of the 706 submarkets that comprise the nation’s 50 largest apartment markets, 15 have yet to completely rebound rents from their pre-pandemic rate. Of those 15 submarkets, most were in urban or urban-adjacent neighborhoods, with Bay Area submarkets taking 10 of the bottom 15 spots. Those 15 submarkets were the only ones to record a cumulative rent change performance in negative territory over the past three years.
Six San Francisco submarkets recorded the weakest performances since March 2020, with three of those submarkets landing at the very bottom of the pack. Downtown San Francisco ranked last, with rents down 11.4%. Average monthly rents in that submarket ($3,204) fall inline with the market average ($3,201). SoMa was second-to-last, with a price drop of 10.2% since the start of the pandemic with monthly rents as of February averaging $3,375, above the market average. And West San Francisco came in third-to-last with prices easing 9.5% taking monthly rents ($3,179) below the market average.
Two Seattle submarkets made the list of the worst 15 performances nationally, with rents in Downtown Seattle down 3.2%, while South Lake Union/Queen Anne recorded a 0.9% contraction. As of February 2023, monthly rents in Downtown Seattle ($2,572) and South Lake Union/Queen Anne ($2,456) were still well above the market average ($2,159).
The only non-West region submarkets to make the list of bottom performers were New York’s Harlem (-9%), Downtown Minneapolis/University (-4.3%) and Northeast DC (-1.9%). Harlem remains a relatively affordable apartment market with average monthly rents as of February at $2,422, a little more than half the New York market average of $4,276. Meanwhile, monthly rents in Downtown Minneapolis/University ($1,702) and Northeast DC ($2,320) were still above their market averages of $1,504 (Minneapolis) and $2,040 (Washington DC), respectively.
The national average rent growth over the past three years landed at 17.7%, taking average effective asking rents to $1,781 as of February 2023.
Given that the top performing submarkets were primarily in Florida, it’s not surprising that Florida markets were the biggest pandemic-era rent gainers, taking six of the top seven positions, led by West Palm Beach (33.3%). Likewise, it’s not surprising that Bay Area markets took the bottom three positions for rent performances since the start of the pandemic, with the weakest performance in San Francisco (-7.6%).
Among the markets represented by the best performing submarkets, only Atlanta had some underperforming submarkets. Six of Atlanta’s 39 submarkets recorded pandemic-era rent growth below the U.S. average, with Downtown Atlanta picking up the rear at 12.5%.
Of the markets that held the worst performing submarkets, few also had star performers. In other words, in markets with multiple submarket laggards, the market generally underperformed as well. Five of Washington, DC’s 36 submarkets posted rent growth above the national norm, with Frederick (24.4%) taking the lead. Four submarkets in Seattle posted growth above the national average, with the biggest bump in Everett (21%). And the only submarket in New York to exceed the national average was New York Northern Suburbs (19.4%). No submarkets in the Bay Area or Minneapolis exceeded the U.S. norm.


