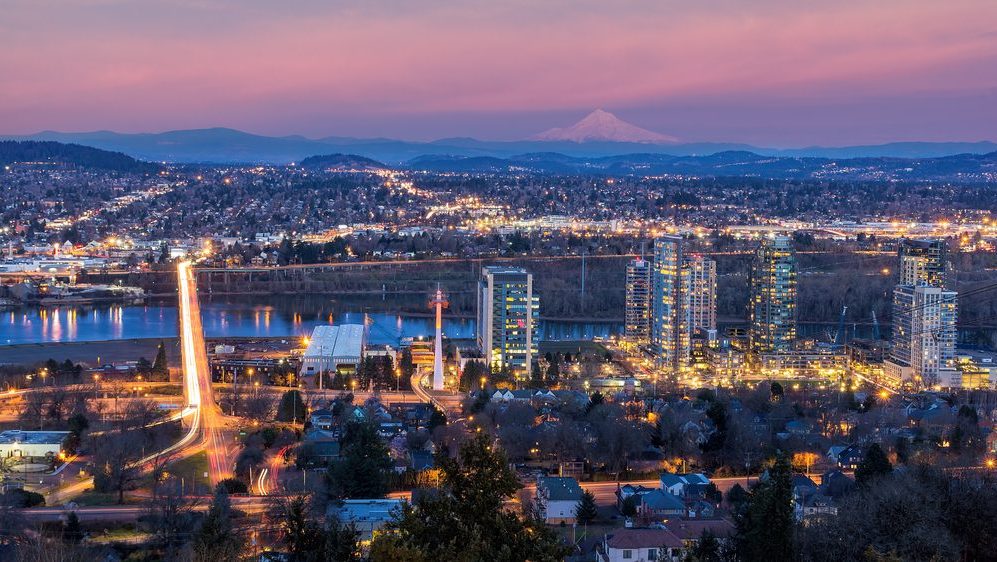
Mixed Apartment Performances in Northern California and the Pacific Northwest

Regional performances in Northern California and the Pacific Northwest offer a little something for everyone – some markets are performing very well, others are meeting national averages, while some are still lagging notably behind U.S. norms.
Even the worst performing markets, however, have logged some progress since hitting recent low points during the worst of the COVID-19 pandemic downturn.

Sacramento
Apartment occupancy in Sacramento hit a high of 98% in September. This was one of the strongest showings nationwide and the best rate Sacramento has seen since just after the tech boom in 2002. During the past year or so, when apartment renters left the Bay Area seeking more affordable product, Sacramento benefitted with a surge in demand. As a result, while many big markets in the U.S. logged a decline in apartment market fundamentals in 2020, Sacramento enjoyed an increase in occupancy and then also enjoyed the nationwide bump in 2021.
Effective asking rent growth was also solid at 15.3% in Sacramento in the year-ending September. This was the third consecutive month that annual rent growth topped 15%. While annual increases here have reached above the 11% mark twice in the past two decades (in 2000 and again in 2016), progress has never gotten past 12%. The Class A product drove recent increases, with year-over-year rent growth hitting a stunning 20.8% in September. Though growth was more moderate in the other product lines, recent progress was still elevated compared to historical norms.
Portland
The Portland apartment market has performed essentially in line with the U.S. average over the course of the past few years. As of September, occupancy in Portland was at 97.4%, right in line with the 97.3% U.S. norm. This performance was well ahead of Portland’s five-year average of 95.6%, which was also in line with the national five-year norm of 95.5%. Portland does differ, however, in the distribution of occupancy across the product spectrum. While U.S. occupancy is tightly clustered around 97% to 97.5% across all asset classes, Portland’s Class C stock is notably ahead of the other two product lines, with a very tight September showing of 98.7%. Class B stock is 97.6% occupied, while the Class A product is 96.3% full. Across the spectrum, however, those rates are notably better than they were just a year ago.
Annual rent growth was at 11.3% in Portland as of September. While this was a bit shy of the national norm of 12%, Portland has displayed the same pattern as the U.S. overall throughout much of the recent past. When rent cuts became the norm in May 2020 across the nation, Portland operators also cut rents. When U.S. rent growth returned in April 2021, Portland also enjoyed the rebounding growth. Since then, price increases have gotten progressively better in Portland, and in the U.S. as a whole.
Seattle
While Seattle is one of the coastal gateway markets that was hit hard during the COVID-19 pandemic, today’s rates show a rebound from those historic lows. Seattle’s occupancy jumped 250 bps in the past year to stand at a solid 97.2% in September. In comparison, the five-year average for this market is closer to 95.4%. Occupancy is stronger in Seattle’s Class B and C product, while the Class A stock lags at 96.5%. While behind the market average, however, occupancy in Class A stock is up notably from its typical pace.
Rent growth has returned to Seattle, after the market saw steep rent cuts throughout much of the past year. Effective rents are up 8.2% year-over-year, which is strong for this market, which hasn’t seen such annual growth since mid-2016. This is also quite different from the rent cuts of 8.4% this market saw earlier this year, in the year-ending March. However, rent growth here is still performing behind the national average.
The Bay Area
Like many other markets nationwide, San Francisco’s Bay Area has seen a rebound in leasing activity in recent months. This surge in demand has helped the region recover from its roll as one of the worst performing areas nationwide during the pandemic downturn in 2020. Apartment occupancy reached 96.8% in Oakland, 96.6% in San Jose and 95.7% in San Francisco in September. The annual occupancy increase in San Francisco was one of the strongest nationwide at 310 bps, tied with Miami as the most progress among the nation’s largest 50 apartment markets. San Jose also logged a notable increase at 250 bps. Oakland – which did not lose as much ground in 2020 as the other two Bay Area markets – logged an occupancy upturn of 130 bps.
Rent growth has returned to the Bay Area, after seeing devastating price cuts just one year ago. San Jose saw the biggest increase, of 8.3% in the past year. Oakland logged rent growth of 6.6%, while San Francisco operators pushed rents an average of 4.6%. While each of these increases were notably behind the national average, they are a welcome sight after price declines that got as deep as 21% in San Francisco at its worst moment in February 2021. Annual declines were as bad as 16% in San Jose and bottomed out at 7% in Oakland.
For more information on the apartment markets in Northern California and the Pacific Northwest, including forecasts, watch the webcast Market Intelligence – Northern California/Pacific Northwest Region.


