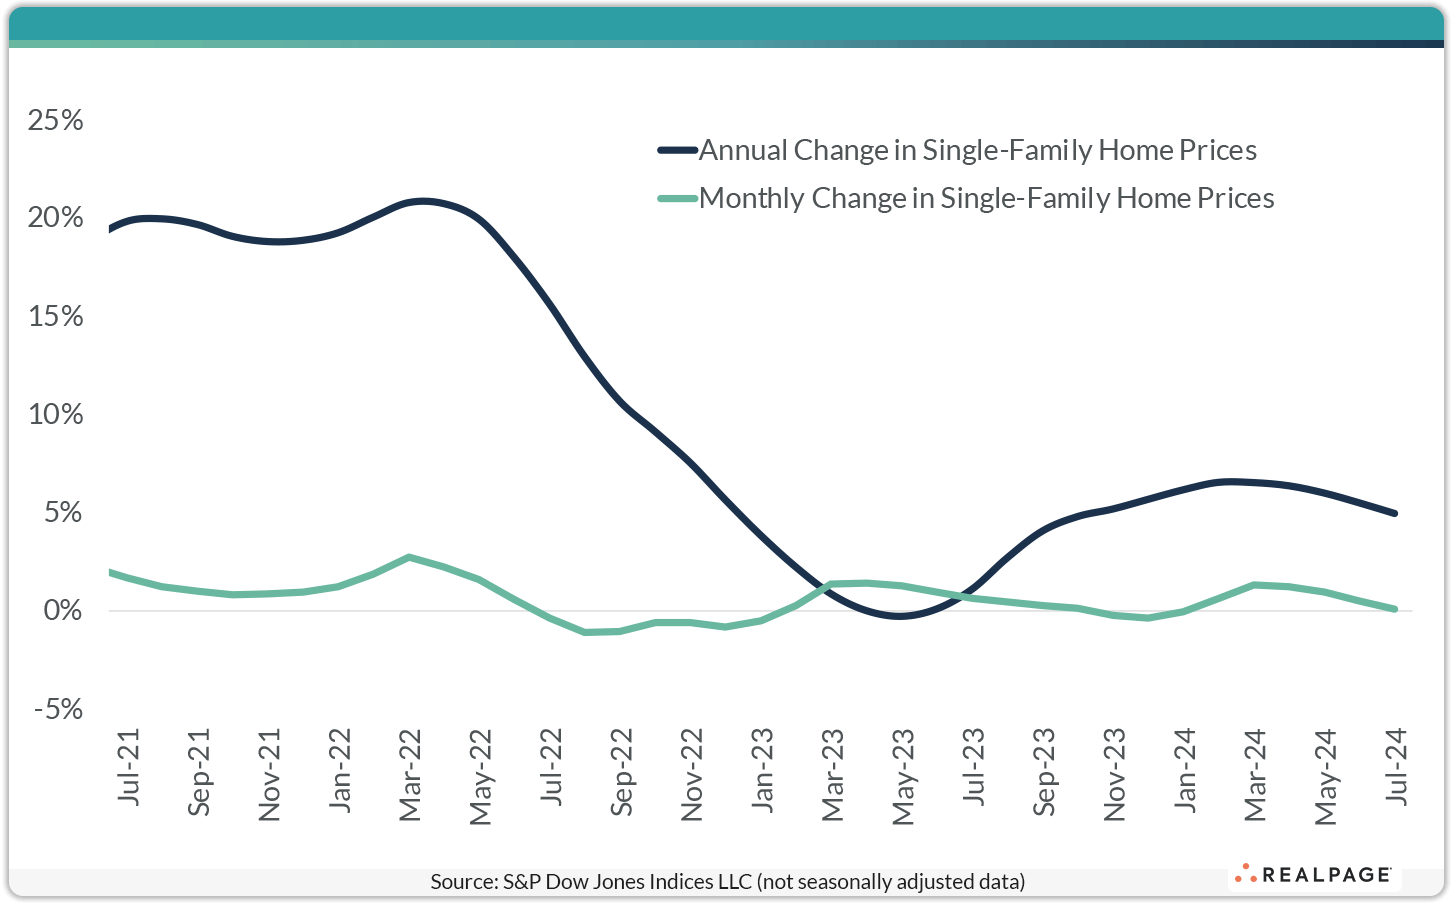
U.S. home price increases continued to slow in July, but prices remain at all-time highs. Overall, U.S. home prices were up 0.1% from June to July, according to the seasonally unadjusted S&P CoreLogic Case-Shiller U.S. National Home Price Index, which measures average home prices across the nation. On an annual basis, home prices were up 5% as of July 2024, down from an annual gain of 5.5% in the previous month and well below the historic peaks of around 20% from June 2021 through June 2022. Looking at more granular results, the S&P CoreLogic Case-Shiller 20-City Composite Index, which tracks prices in the 20 largest metros, was essentially unchanged month-over-month but was up 5.9% year-over-year. As of July, 12 of the 20 cities in the index reported month-over-month price gains, with the largest monthly increases in Cleveland (1.1%) and Las Vegas (0.9%). On an annual basis, all 20 metro areas recorded higher prices, with the biggest hikes in New York (8.8%) and Las Vegas (8.2%). Portland posted the smallest year-over-year gain of 0.8%.


