Apartment Market Comparison: The Bay Area Trio

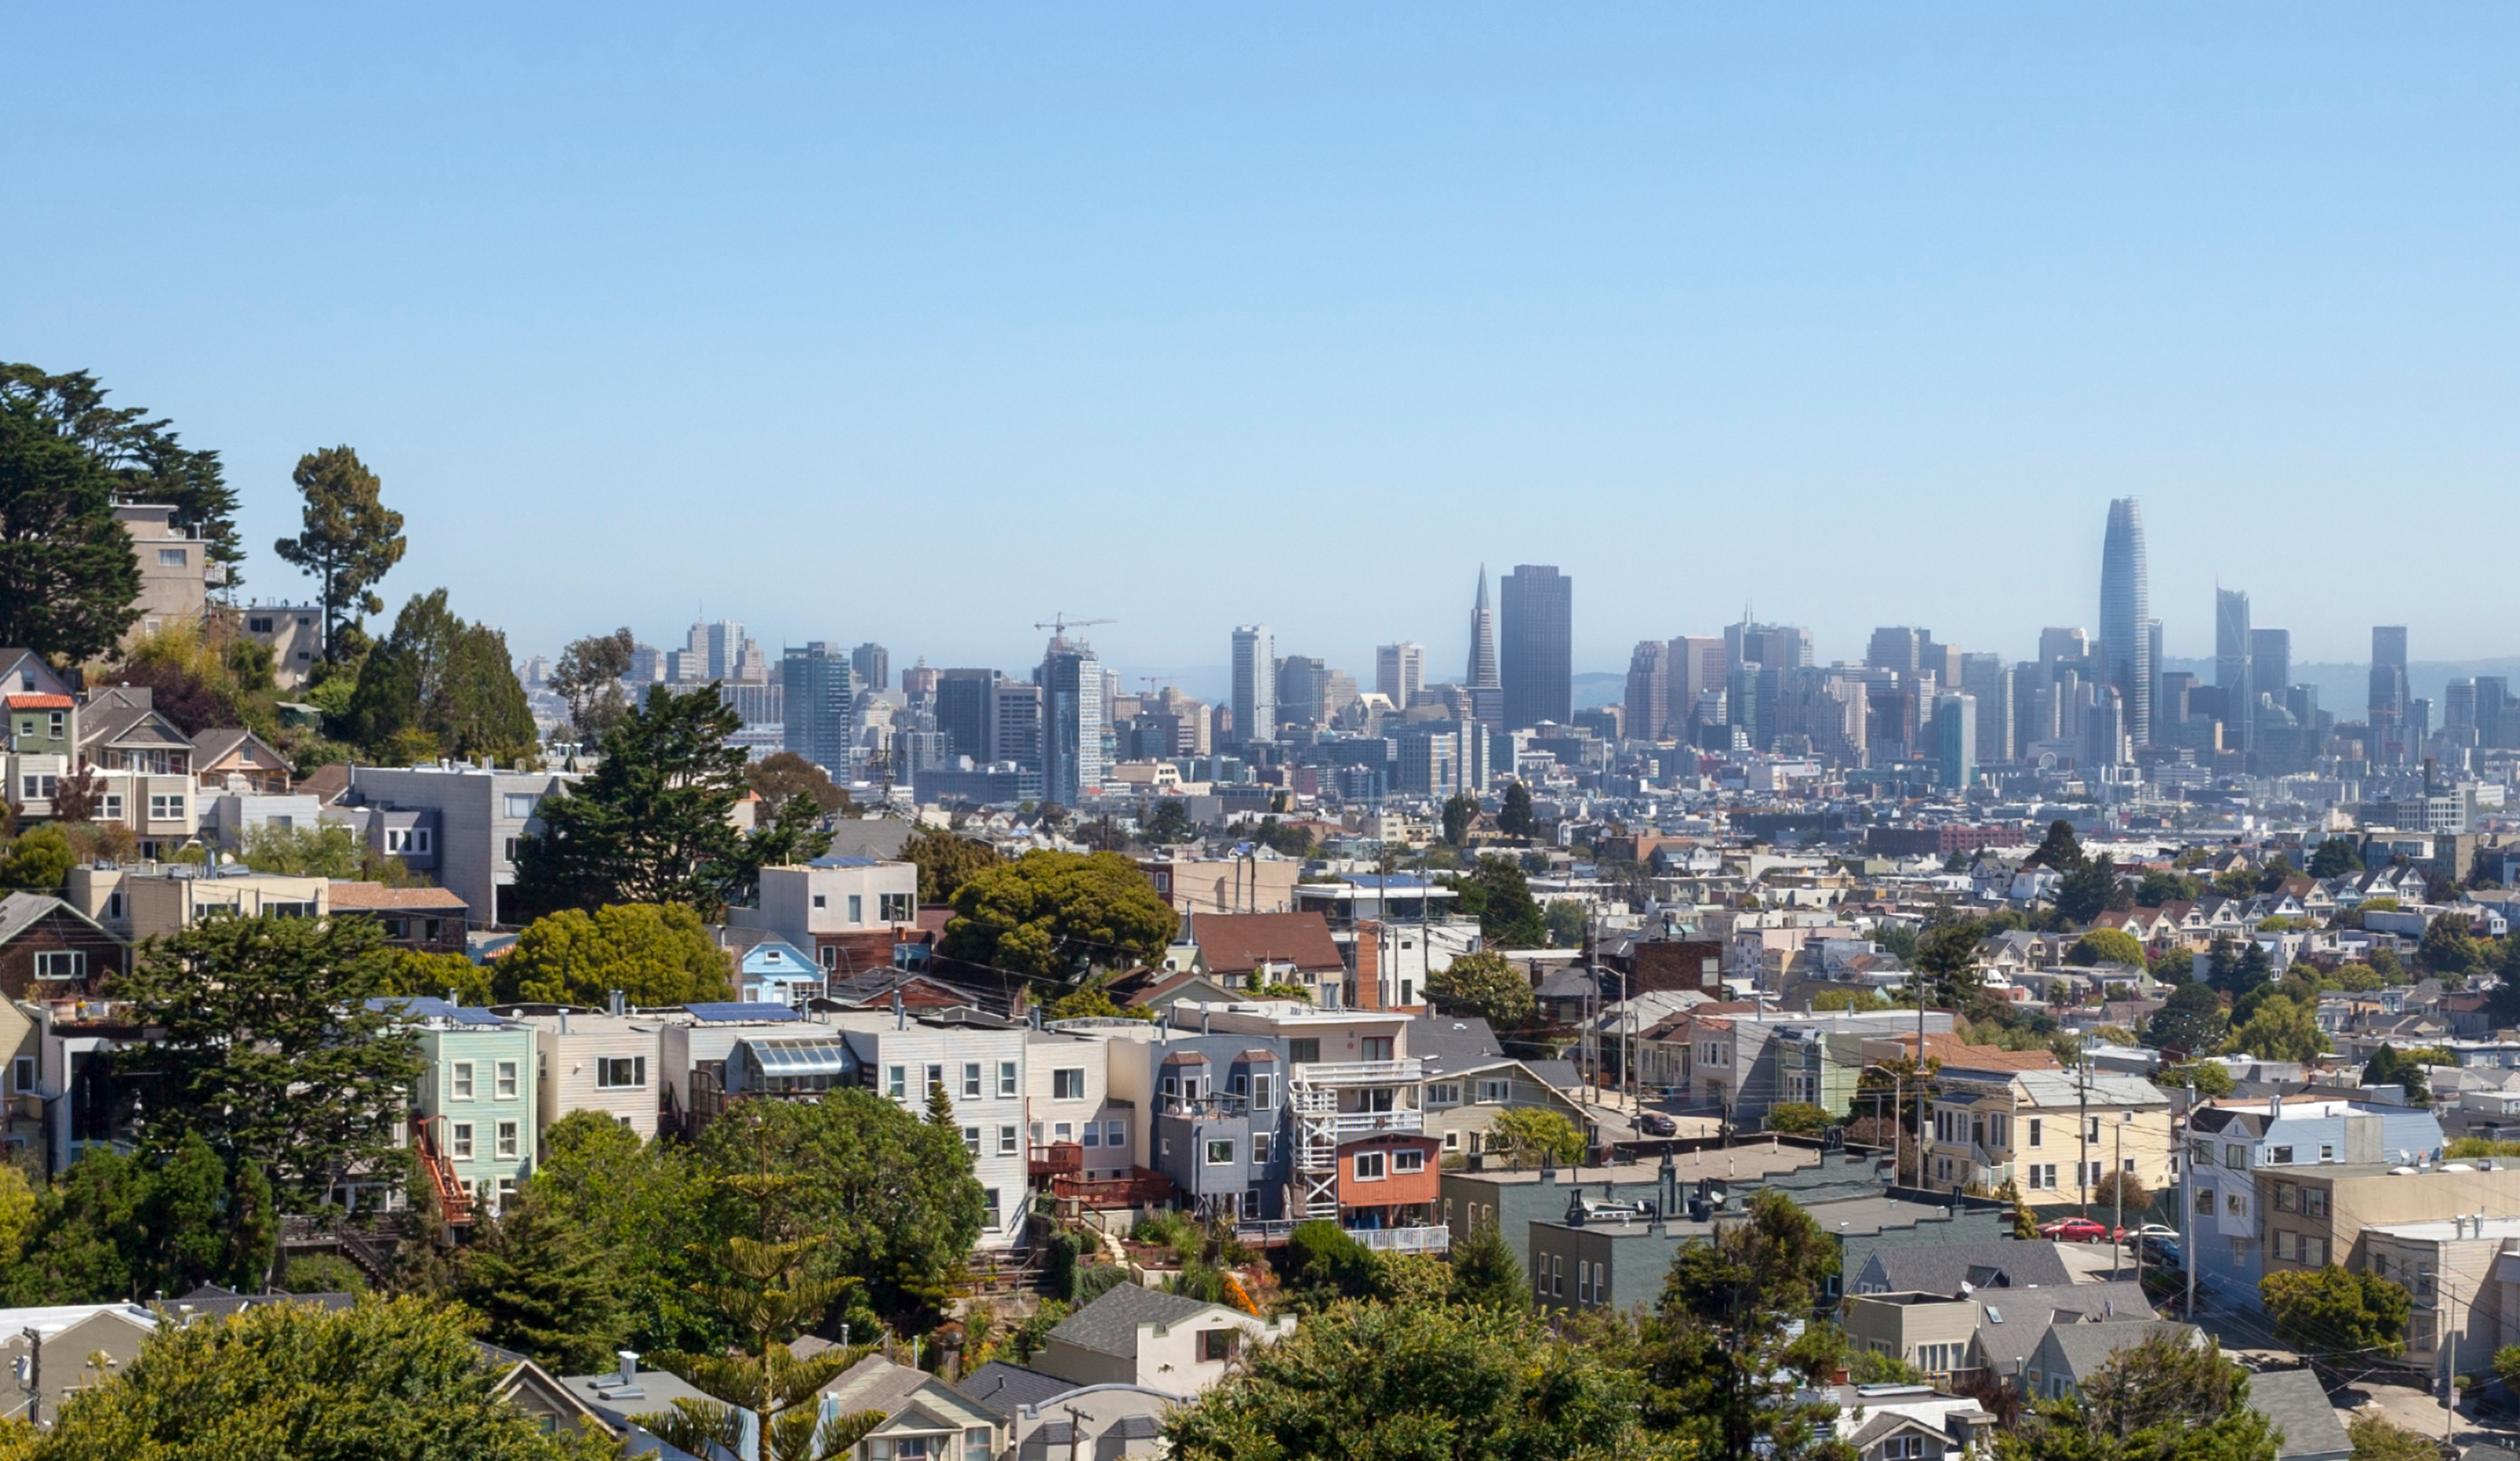
San Francisco is the commercial and cultural center of Northern California. San Jose is home to the Silicon Valley technology hub. And Oakland is a major West Coast port.
These neighboring apartment markets combine to make up the Bay Area region. While very similar in demographic makeup, there are slight differences in these multifamily markets. Over the next several weeks, RealPage Market Analytics will be exploring the similarities and differences of neighboring apartment markets.
Oakland boasts the region’s largest population with 2.8 million residents, according to data from the U.S. Census Bureau. San Jose has 2 million people, while the population in San Francisco is the smallest in the region, estimated at 1.9 million residents.
San Francisco saw one of the nation’s worst domestic outmigration patterns in 2021. While almost 5,000 people migrated to the city from outside of the country, that was no match for the 128,900 or so people who moved out to other U.S. cities during the year. Only New York and Los Angeles saw more out-migration domestically. San Jose and Oakland also logged domestic out-migration in 2021, but at much smaller levels, at around 45,000 to 55,000 people. This loss of residents led to net move-outs in the Bay Area region recently, which caused occupancy to stumble and rent growth to falter.
The economic base in San Francisco has yet to recover from pandemic-era job cuts. Total employment as of December 2022 came in 3,200 jobs below the job count from before the pandemic in February 2020, according to data from the Bureau of Labor Statistics. Other parts of the Bay Area region, on the other hand, have seen notably better performances. The job base in San Jose has recovered very well, with a workforce that is now 30,900 workers ahead of pre-pandemic norms from February 2020. Oakland’s job base – which is heavy in the highly affected Leisure and Hospitality sector – is now 4,400 jobs ahead of its February 2020 count.
The median household income across the Bay Area is notably ahead of the national average of roughly $69,000, according to five-year estimates from the U.S. Census Bureau. The share of residents with bachelor’s degrees in these three metros is also notably ahead of national norms. San Jose has the largest median income of about $139,000, while San Francisco – which has the biggest population of residents with bachelor’s degrees at 56.9% – is not far behind at roughly $130,800. Oakland comes in a bit lower at about $111,400, which is still almost double the U.S. average.
Rent-to-income ratios in Oakland are roughly in line with the national norm of 23%, according to the latest data from RealPage Market Analytics. Rent-to-income ratios are a bit lower in San Francisco (21.5%) and San Jose (20.2%). Effective asking rental rates in these markets are some of the highest nationwide. As of January, prices were the most expensive in San Francisco at $3,187. Only New York commands higher prices. San Jose is #3 nationwide with rates of $3,022. The most affordable prices in the region can be found in Oakland at $2,601, thought that is still over $800 above the national average.
When looking at the makeup of the resident base, two big renter cohorts stand out in the Bay Area. Roommates by Necessity is the largest segment of the renter base here, accounting for 30% to 50% in all three markets. Affluent Singles is another big contender, with 30% to 40% of the local population hitting in that category.
Apartment supply across the Bay Area has been significant in the past decade. Deliveries have been highest in San Jose, with over 32,200 units built in the past ten years, increasing the existing stock by 21.3%. New supply totaled over 24,700 units in San Francisco, resulting in growth of 10.9%. Meanwhile, Oakland saw the fewest apartment additions at nearly 20,800 units, which increased the base by 10.4%. In San Francisco, the SoMa submarket has seen notable inventory growth of about 45% in the past decade, though the increase was also significant in South San Mateo County at 21%. Tremendous growth of nearly 90% was seen in San Jose’s North San Jose/Milpitas submarket, though growth was also strong at around 30% in Central San Jose and Santa Clara. In Oakland, the Livermore/Pleasanton submarket grew by over 20% in the past decade, while growth was also big in Oakland/Berkeley at 15.7%.

After completing a little over 8,900 units in the past year, developers are scheduled to deliver another 8,600 or so units across the Bay Area region in 2023. Completions are scheduled to drop off notably in Oakland and San Jose in the coming year, while deliveries should pick up a bit in San Francisco. Oakland is slated to see the biggest volume of new apartment additions with nearly 3,500 new units coming online. Meanwhile, San Francisco is scheduled to see a little more than 2,600 units finish this year and San Jose will receive about 2,500 more units.
Next, explore the similarities and differences of neighboring apartment markets in South Florida.


