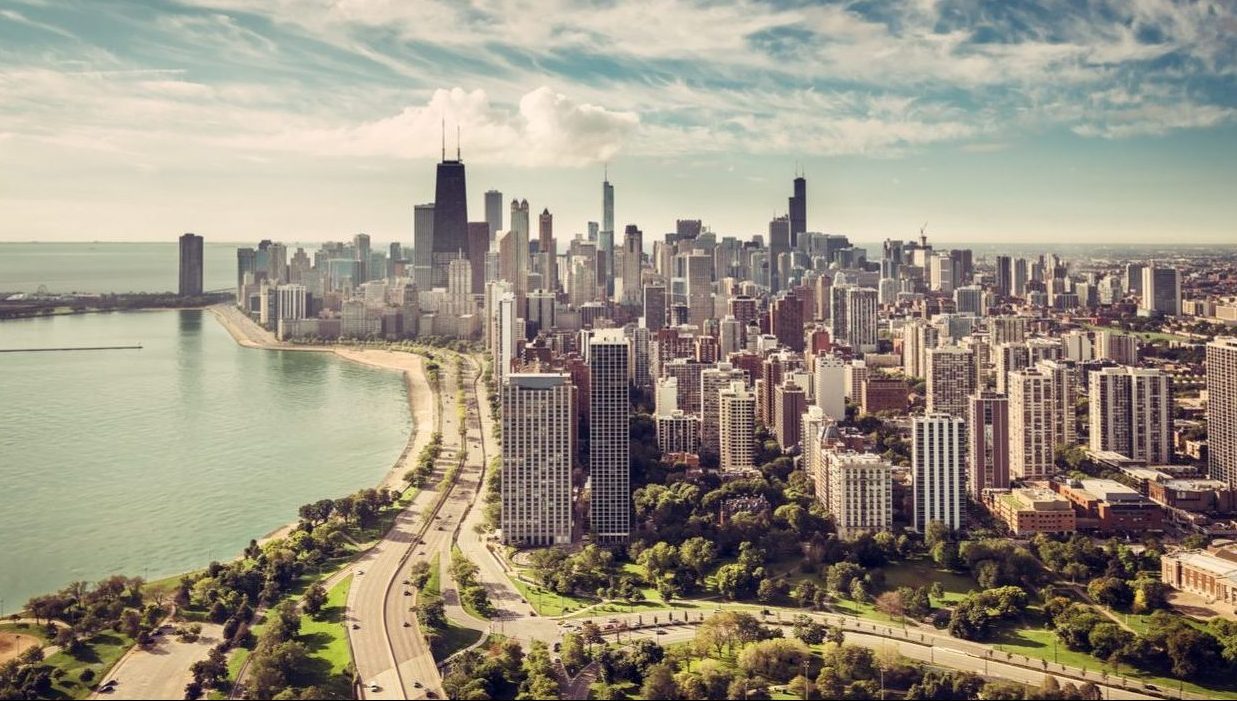
Apartment Completions in Chicago Hit a 20-Year High

Annual apartment delivery volumes in Chicago have reached a two-decade high, and completion volumes continue to be driven by development in the market’s urban core.
In the year-ending 2nd quarter 2019, new supply volumes stretched to nearly 10,300 units, the biggest volume the market has seen in at least 20 years. That completion level results from steadily growing development activity in the market. In fact, during the first three years of the current economic cycle, new apartment supply volumes in Chicago lagged some other large markets, averaging at just about 2,200 units annually in 2010 through 2012. That average more than doubled throughout the next three years, with annual deliveries stepping up to a little over 4,800 units. Late 2016 was when record highs started becoming a reality in Chicago, with annual completions reaching beyond the 8,000-unit mark.

Recent deliveries have made up for those first few years of lagging supply volumes, ranking Chicago as one of the nation’s leaders for apartment completions throughout the span of the economic cycle. Over 53,700 units have completed in Chicago since the beginning of 2010, placing the market in the #10 spot nationally for total cycle supply. These new units grew the existing base in Chicago a moderate 7.4%, well behind the 12.7% national average.
A little over half of Chicago’s total volume of supply during the current cycle has completed in the pricey urban core submarkets. These two areas have also fueled the bulk of market-level apartment demand in the past few years.
The Loop, which includes Chicago’s downtown and central business district, has seen the addition of nearly 14,100 units in the cycle, growing its existing base by nearly 64%. Just in the year-ending 2nd quarter, over 3,000 of those units came online, marking the biggest supply year in the history of the submarket. This aggressive growth has held back occupancy in this submarket’s Class A product line, but not by much. And overall, Chicago’s Loop has performed relatively well for occupancy and rent growth. Occupancy here was at 94.6% in 2nd quarter. Though below the market norm – held back slightly by a 94.5% showing in that big block of Class A stock – this rate was a bit ahead of the submarket’s long-term average. The Loop saw rental rates climb 3.7% year-over-year, well ahead of the 2.4% increase seen in Chicago overall. Monthly rents in The Loop are some of the priciest in the market at $2,286.

Just north of downtown, the Streeterville/River North submarket has seen over 14,200 units complete during the current cycle, swelling the existing stock by nearly 40%. At 95.5%, this is one of the submarket’s best occupancy readings in 20 years and was one of the best in Chicago in 2nd quarter. This is the market’s most expensive submarket, with monthly rents of $2,494, and annual rent growth was just ahead of the market average at 2.8% in the year-ending June.
Even after significant cycle growth, the size of the existing base in these two urban core areas remains modest compared to the product centers in the Central Cook County, Evanston/Rogers Park/Uptown and South Cook County submarkets. These submarkets, located west of the urban core and spanning much more physical space, are heavy in Class B and C product.
New supply volumes in Chicago are scheduled to remain elevated moving forward. Nearly 9,400 units are slated to complete in the coming year, swelling the existing base by another 1.3%. The two prime urban core submarkets account for over half of the identified projects underway.


